ArcGIS 10.x
This software package was most frequently used during my time at Niagara College. Using the Spatial Analyst Extension, I developed the ability to conduct an overlay analysis using both Multi-Criteria Evaluation (MCE) and Fuzzy Logic. The processes of the overlay analyses were then automated using the model builder. Using the Geostatistical Analyst extension, I created interpolated surfaces using the Inverse Distance Weighted (IDW) and Kriging methods. This required an in-depth statistical investigation of data to understand how to create a surface representative of reality and to further understand how accurate the results were. I have also had experience georeferencing images in ArcGIS as well using the ArcHydro Tools Extension for my thesis project.
Buffer/Overlay Analysis
This deliverable contains a formal report detailing the procedures and outcomes of an overlay analysis conducted for Niagara-on-the-Lake, Ontario. The goal of the overlay analysis was to determine possible areas at risk of water contamination and/or quality impairment as a result of wine production in the city. By completing this deliverable, many features available within the ArcGIS suite by ESRI were utilized. Thus, I was able to gain practical experience completing a full project with the use of commercial GIS software. The data utilized in this project are fictitious.
Spatial Analyst Extension
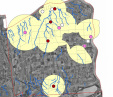
This deliverable contains a memo outlining the process and result of undertaking a Weighted Multi-Criteria Evaluation and Fuzzy Overlay Analysis. Using ArcMap 10.1, an industry leading GIS software package, these two methods were utilized to determine the most suitable areas for re-introduction and survival of the Osmunda Finlayensis fern species. It was determined that the results derived from the Weighted Multi-Criteria Evaluation are the best because the methods were carefully planned and there are no findings to discredit the outcome. Within this result, there are a total of 359 suitable areas that can support one of the 110 ferns per area.
Model Builder
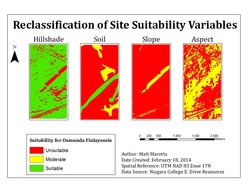
This assignment is a model produced to automate the processes used for the Spatial Analyst Extension assignment.It uses a Soils shapefile and TIN as input files. Using these two files, the end result is two raster files; one created from a weighted overlay and another created from a fuzzy overlay. Each output raster displays the suitability of the study area for re-introducing a fictitious fern species.
Geostatistical Analyst Extension
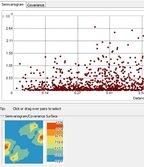
This deliverable contains a formal report in which I collect data and use ArcGIS Geostatistical Analyst to explore these data and produce a predicted surface. Using a sample of 52 golf courses
in the study area, interpolated surfaces were produced showing predicted green
fee rates anywhere within the study area.
Two different interpolation techniques, Inverse Distance Weighted and
Kriging, were utilized to produce the interpolated surfaces.
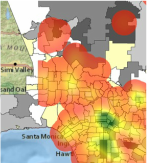
Crime Analysis
|
This project provided a temporal analysis for the percent change in crime by zip code in Los Angeles County from 2008-2012. It used methodologies such as a kernel density, comparing changes in crime to the proximity of four social services (homeless shelters, substance abuse services, sheriff and police stations, mental health facilities); created separate tools via python scripts to automate the processes of crime location (i.e. clustering) and identification of single crime types (i.e. violent/nonviolent); and lastly provided a comprehensive demographic understanding of Los Angeles County to understand other social pressures influencing criminal activity (i.e. Poverty, Unemployment, Mean Household Income). This project also enhanced teamwork skills as it was completed in a group with three other classmates.
|
