Geospatial Catalog Project Developer
This project has been submitted in order to showcase the work that has been done in Niagara as it pertains to the Niagara College GIS/Geospatial Management program of which a number of Brock University students have participated in. This is an important project for three main reasons:
1) It will raise the profile of the Niagara College program as a whole, both within the region and across Canada. A rise in profile will serve to attract students and employers to Niagara.
2) It illustrates the economic impact that the geospatial tech/information sector could have in Niagara region. As an example, the projects completed in 2013/14 totalled approximately $975,000.
3) It is an important collaborative initiative between Niagara College/Brock and Geospatial Niagara as a stepping stone to Niagara being declared an ESRI Centre of Excellence.
Plans for how this project was going to be completed began in September of 2014. These plans were executed in December of 2014 and the project was completed in January of 2015 after 120 hours of work required by the Brock University Geography Department Internship Program. Not only does this project include a fully functional 'Geospatial Catalog' of Niagara College GIS-GM Thesis Projects, but it also includes a plan for how to build upon the work that has already been done. Currently, the Catalog exists in the form of a website, which can be seen below in the screenshots.
This first screenshot is the index (home) page with some annotations to better understand its functionality. Certain data has been blurred due to potential data sensitivity.
This first screenshot is the index (home) page with some annotations to better understand its functionality. Certain data has been blurred due to potential data sensitivity.
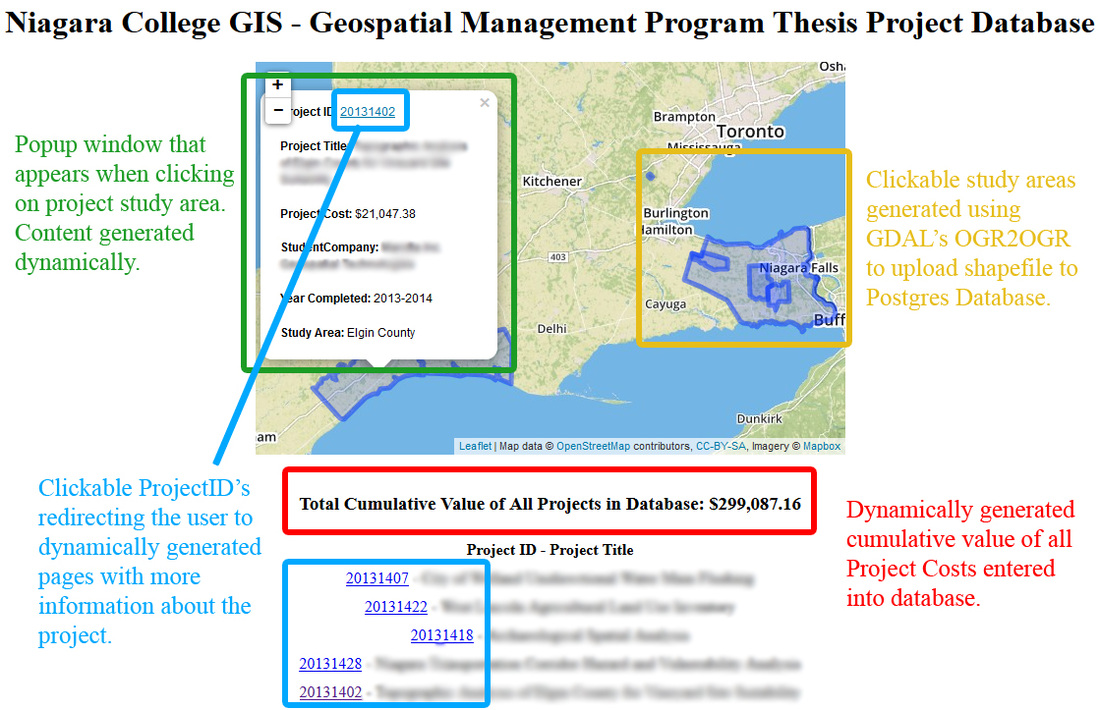
The second screenshot seen below is a view of a page for an individual project, which is accessed by clicking on any one of the ProjectID's that are on the homepage.
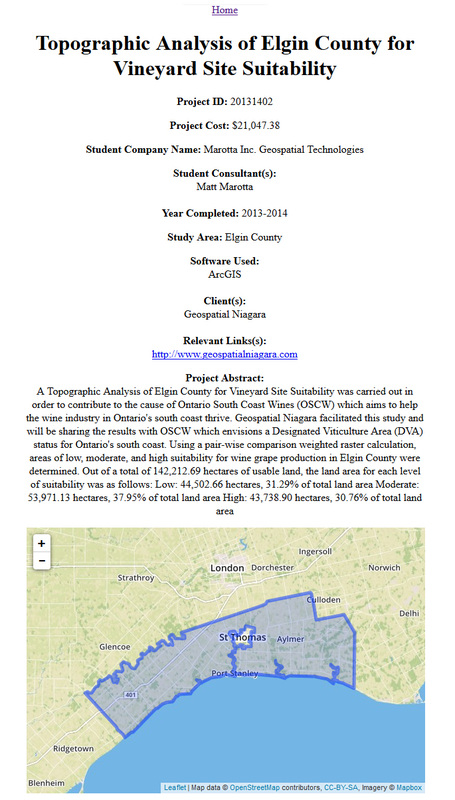
Although the two web pages are rather plain, they do not have to be changed in the future if more records are added. Currently, only about 10 records exist in the database to demonstrate the power of a dynamic website that utilizes PHP. An administrator simply needs to enter data into the database and it will automatically appear on these webpages. A new layout will be designed in the future, along with a few other upgrades in functionality, once Geospatial Niagara finalizes a project scope with Niagara College...keep reading to learn what is planned for the future!
How does it all work?
First, take a look at the diagram below. Notice how the PHP Script is the heart of the entire process...it retrieves data from the server based on a user request and sends it to the web pages. A detailed description can be found below the diagram.
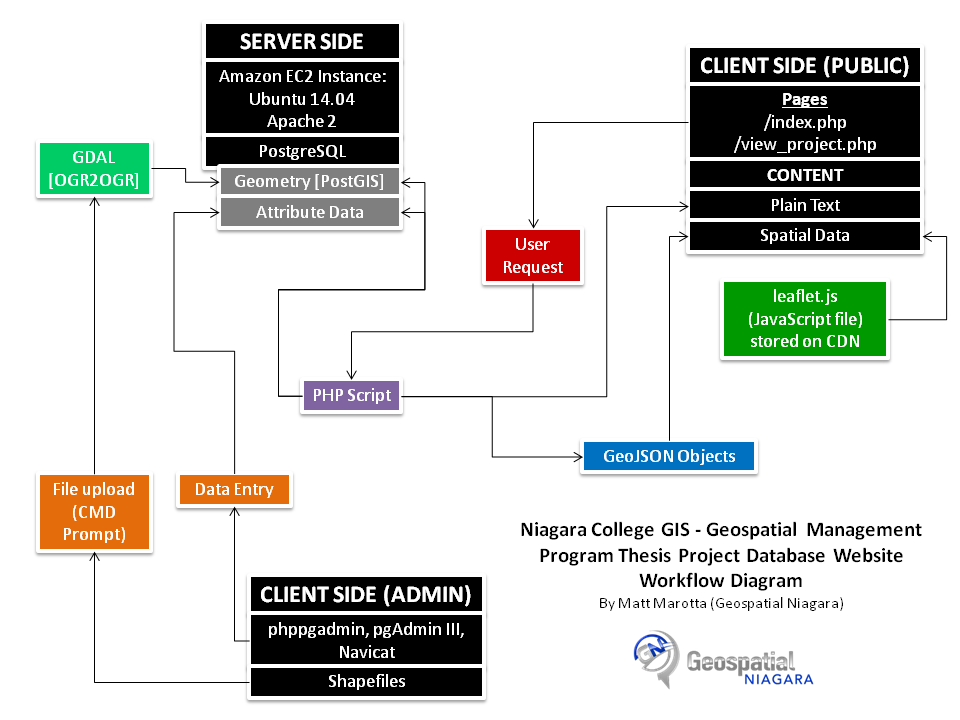
The easiest place to begin is at the Client Side (Admin). This is how an administrator gets data into the database. Spatial and non-spatial data had to be added to the database in different ways, thus two different flows of information.
At this point, it should be evident how data flows from the Client Side (Admin) to the Server Side.
The server side is required to interpret the PHP files and host the PostgreSQL database, on top of many other functions. The server is an Amazon EC2 server running Ubuntu 14.04 with Apache 2. Amazon EC2 servers are reliable, scale-able, and very cost effective compared to purchasing a physical server.
The next place to look is at the Client Side (Public). When a user attempts to access one of the two pages, a request is sent to the server to retrieve data. This is all done through the PHP script. So, here's how that works:
The last process to notice is the leaflet application being sent to the Client Side (Public) from a different source. This is because the Leaflet JavaScript file is stored on a Content Distribution Network (CDN), which is basically a bunch of servers that 'serve' the file to clients for the purpose of high performance and accessibility. This file could be stored on the Amazon server, but using the CDN-stored file may actually be better because it will allow the Amazon server to only have to serve clients the PostgreSQL data and not the leaflet application as well.
- Adding Non-Spatial Data: phppgadmin is a web application for creating tables, defining relationships/data types, and adding data to the database. pgAdmin III is virtually the same thing, except it is software that can be installed on a computer and then connects to the database with a username, password, IP address, etc. Navicat is another software package for connecting to a database, but it has more functionality than pgAdmin III. Either of these three methods works for adding data to the database. The administrator simply types the appropriate information and it is stored in the database.
- Adding Spatial Data: spatial data is a little more complicated to insert into a PostgreSQL database. The easiest method seemed to be first uploading one shapefile containing all study area boundaries to the server, and then converting the shapefile to PostgreSQL (PostGIS) Geometry using GDAL's OGR2OGR. Uploading and conversion of the shapefile is done through Command Prompt in Windows; once that is done, the spatial data is stored in the database and linked to the non-spatial attributes through a common 'ProjectID' field.
At this point, it should be evident how data flows from the Client Side (Admin) to the Server Side.
The server side is required to interpret the PHP files and host the PostgreSQL database, on top of many other functions. The server is an Amazon EC2 server running Ubuntu 14.04 with Apache 2. Amazon EC2 servers are reliable, scale-able, and very cost effective compared to purchasing a physical server.
The next place to look is at the Client Side (Public). When a user attempts to access one of the two pages, a request is sent to the server to retrieve data. This is all done through the PHP script. So, here's how that works:
- User request sent to PHP script stored on server
- PHP script accesses the database and retrieves the appropriate spatial and non-spatial data
- PHP script then sends the data to the Client Side (Public)
- Plain text sent directly to the client's web browser
- Spatial data is converted from PostGIS format to GeoJSON (a format supported by Leaflet) with the PHP script, then sent to the client's web browser
The last process to notice is the leaflet application being sent to the Client Side (Public) from a different source. This is because the Leaflet JavaScript file is stored on a Content Distribution Network (CDN), which is basically a bunch of servers that 'serve' the file to clients for the purpose of high performance and accessibility. This file could be stored on the Amazon server, but using the CDN-stored file may actually be better because it will allow the Amazon server to only have to serve clients the PostgreSQL data and not the leaflet application as well.
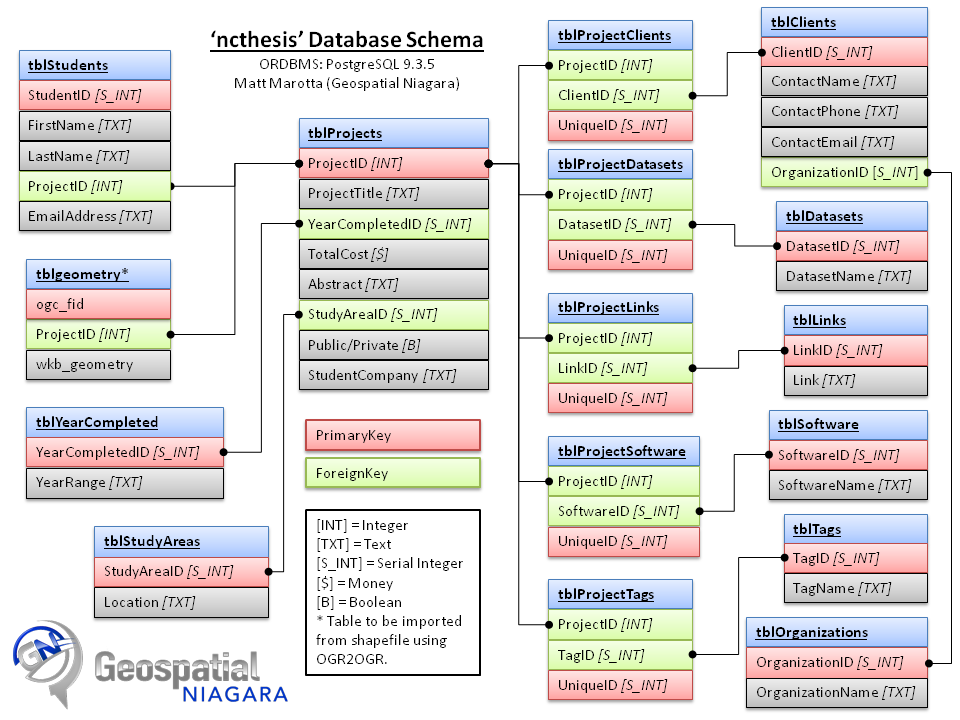
Database Schema
The diagram below illustrates the tables, fields, data types, relationships, and keys of the database. The amount of many-to-many relationships make the database a lot more complicated. For example, one project can use multiple software packages for completion, and one software package can be used to complete multiple projects. However, this is absolutely necessary to maintain data integrity.
Future Plans
There are many ways in which this Website could be improved in the future, but some of the options include:
Watch out for an improved version of this project to be launched and made available to the public hopefully soon!
- Implementing a search engine functionality
- Improving the layout and design of the website
- Creating a PHP data entry form than can be used by students (user accounts would also be required)
- Allowing students to submit shapefiles online
Watch out for an improved version of this project to be launched and made available to the public hopefully soon!
