Crime Analysis
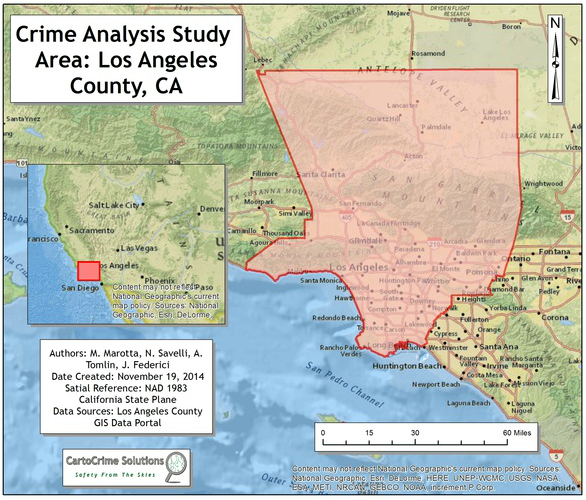
This project provided a temporal analysis for the percent change in crime by zip code in Los Angeles County from 2008-2012. It used methodologies such as a kernel density, comparing changes in crime to the proximity of four social services (homeless shelters, substance abuse services, sheriff and police stations, mental health facilities); created separate tools via python scripts to automate the processes of crime location (i.e. clustering) and identification of single crime types (i.e. violent/nonviolent); and lastly provided a comprehensive demographic understanding of Los Angeles County to understand other social pressures influencing criminal activity (i.e. Poverty, Unemployment, Mean Household Income). This project also enhanced teamwork skills as it was completed in a group with three other classmates.
CLICK HERE TO VIEW THE PYTHON SCRIPTS USED IN THIS PROJECT
CLICK HERE TO VIEW THE PYTHON SCRIPTS USED IN THIS PROJECT
Study Area
Datasets Used
Los Angeles County GIS Data Portal
Polygon Shapefile of Los Angeles County zip code areas
Polygon Shapefile of Los Angeles County cities
Point Shapefile of social services in Los Angeles County
Excel spreadsheets of crimes for 2008 and 2012
California Department of Finance
Spreadsheets for:
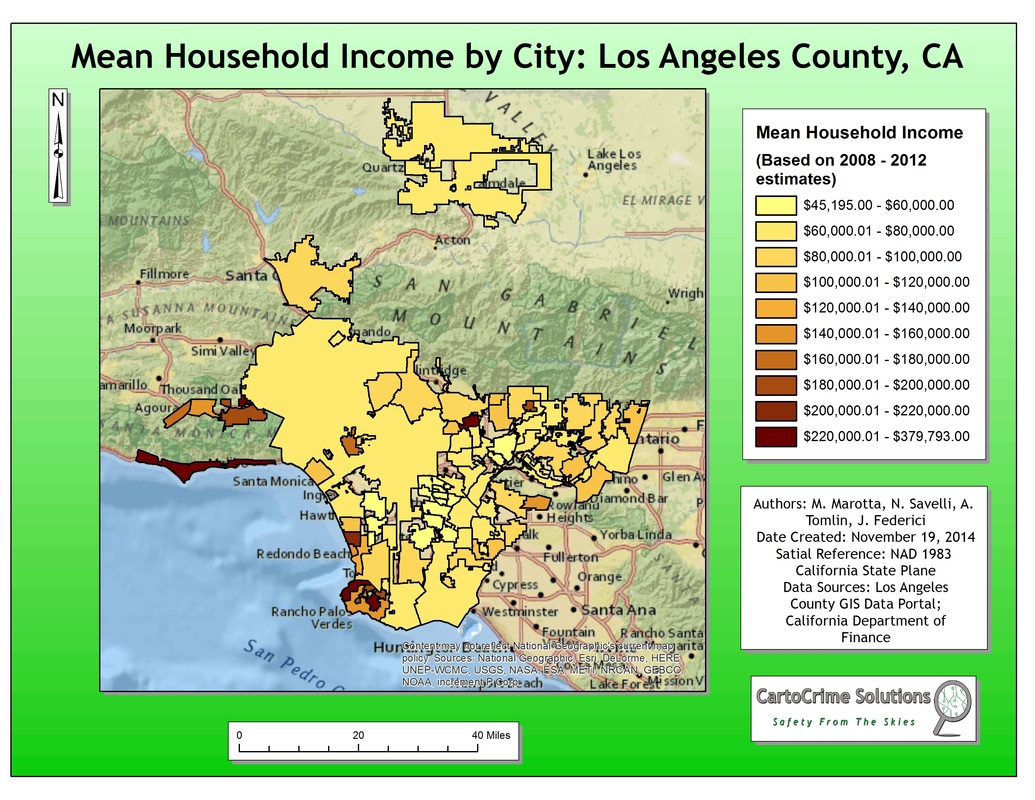
Mean Household Income
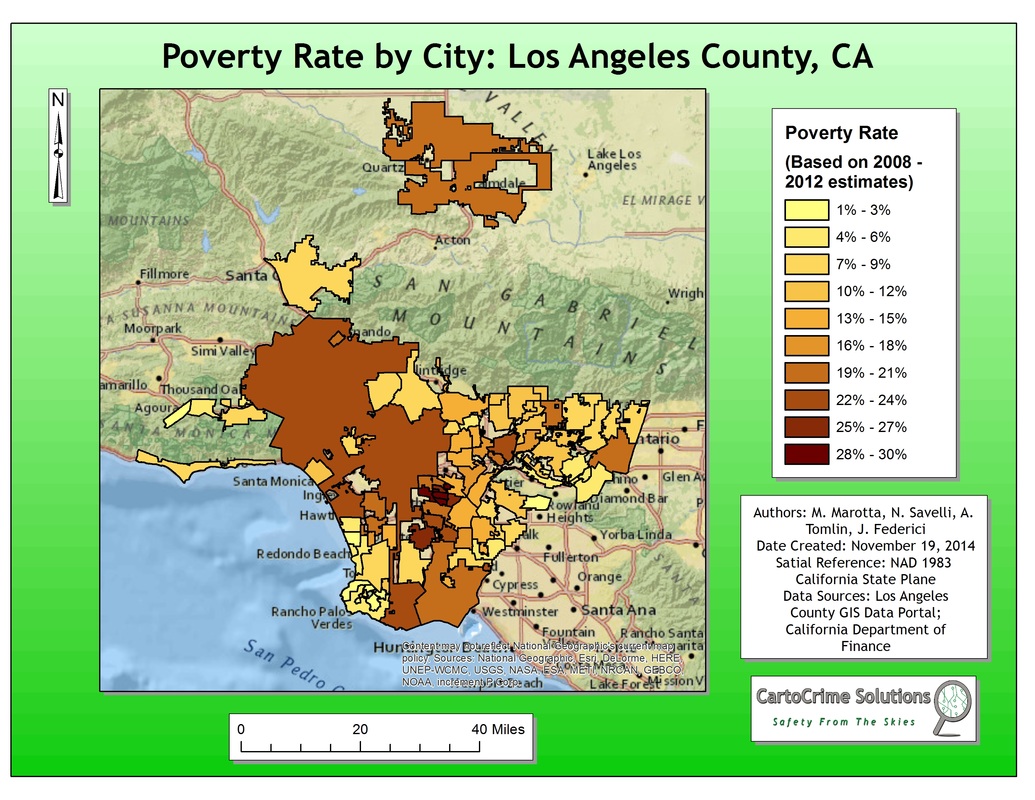
Poverty Rate
Unemployment Rate
(Each by City & based on 2008-2012 estimates.)
Polygon Shapefile of Los Angeles County zip code areas
Polygon Shapefile of Los Angeles County cities
Point Shapefile of social services in Los Angeles County
Excel spreadsheets of crimes for 2008 and 2012
California Department of Finance
Spreadsheets for:
Mean Household Income
Poverty Rate
Unemployment Rate
(Each by City & based on 2008-2012 estimates.)
Methods
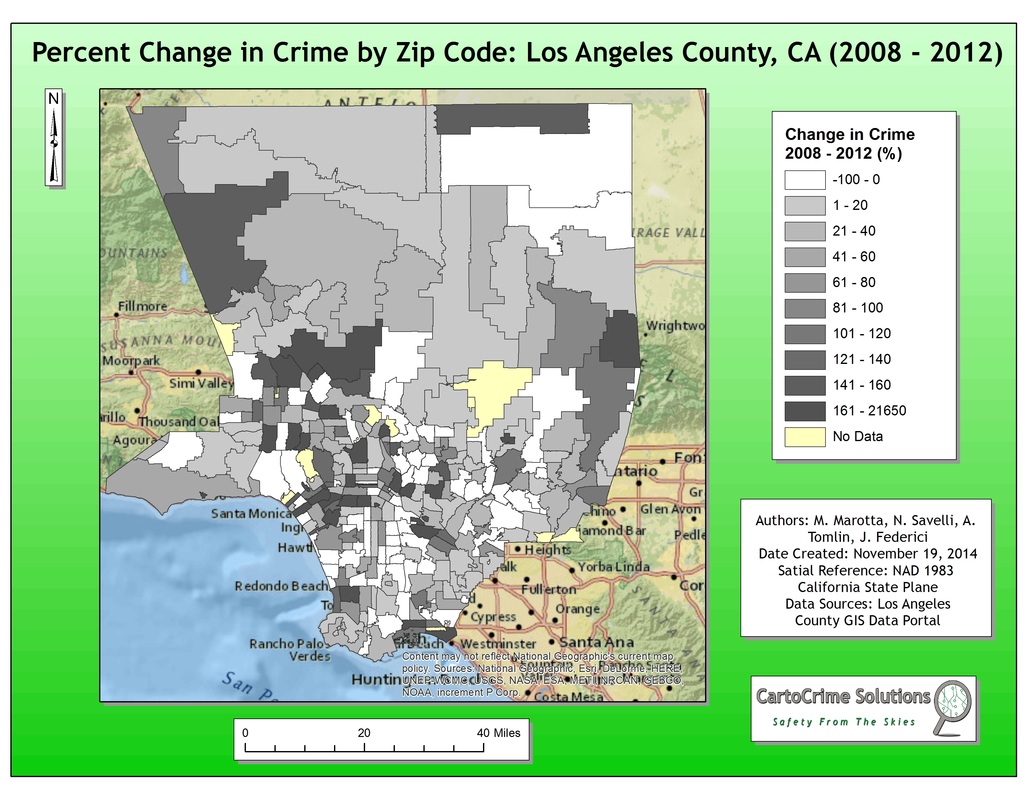
Temporal Analysis
- Divide Los Angeles by zip code
- Generate a layer to visualize the changes in total crime from 2008 - 2012
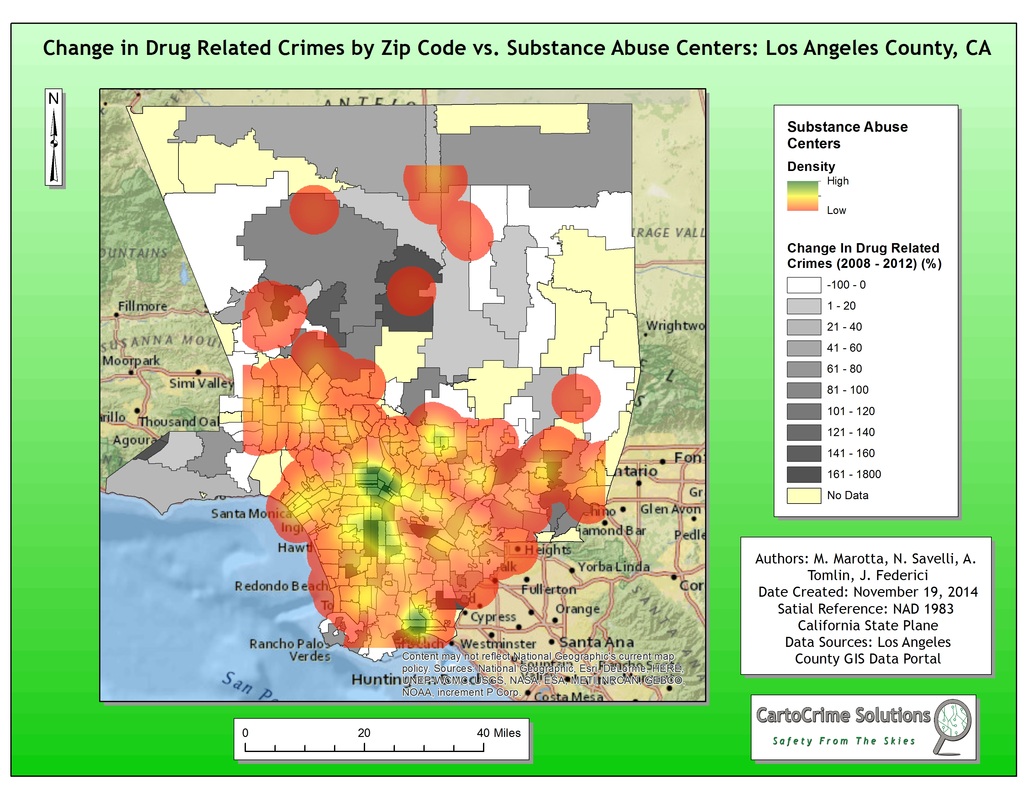
Kernel Density
- Generate a kernel density raster of social services
- Plot these rasters on top of changes in crime
Isolated Crime Variable Cartography
- Mapping percent change in specific crimes against related independent variables
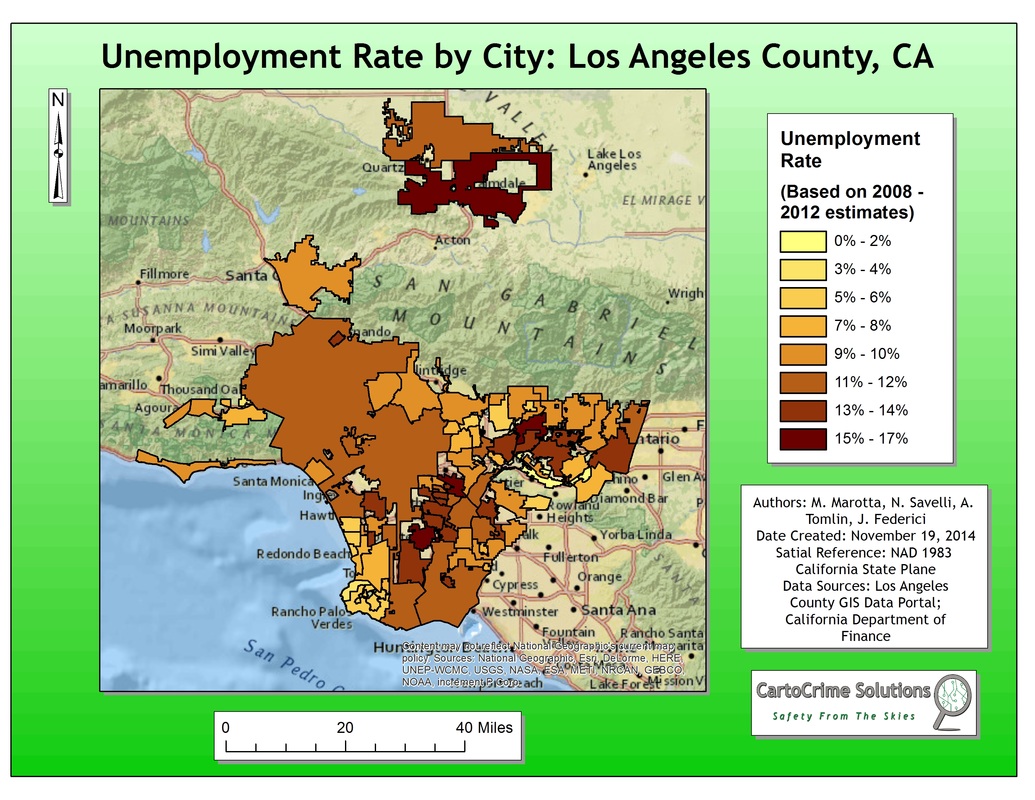
Statistical Demographic Cartography
(Poverty Rate, Mean Household Income, Unemployment Rate)
Automation
- 3 python scripts to convert raw excel spreadsheet (CSV) of crimes (as points) from two different years to a layer showing % change in crime between the two years
CLICK HERE TO VIEW THE PYTHON SCRIPTS
- Divide Los Angeles by zip code
- Generate a layer to visualize the changes in total crime from 2008 - 2012
Kernel Density
- Generate a kernel density raster of social services
- Plot these rasters on top of changes in crime
Isolated Crime Variable Cartography
- Mapping percent change in specific crimes against related independent variables
Statistical Demographic Cartography
(Poverty Rate, Mean Household Income, Unemployment Rate)
Automation
- 3 python scripts to convert raw excel spreadsheet (CSV) of crimes (as points) from two different years to a layer showing % change in crime between the two years
CLICK HERE TO VIEW THE PYTHON SCRIPTS
Social Pressures Influencing Criminal Activity
Percent Change in Crime by Zip Code
Example: Change in Drug Related Crime vs. Density of Substance Abuse Centers