Topographic Analysis of Elgin County for Vineyard Site Suitability
Part of the GIS-Geospatial Management program at Niagara College involves a thesis project conducted over the course of the entire program. This first began by creating resumes and cover letters to apply for various projects with companies/organizations within the Niagara Region and beyond. After applying for a few different projects, I accepted the opportunity to work with Darren Platakis of Geospatial Niagara. I then began investigating the tasks that would need to be completed to successfully meet the goals and objectives desired by Mr. Platakis and Geospatial Niagara. This led to an estimated budget, schedule, and detailed overview of how the project would be completed.
Actual work on the project began in October of 2013 and was completed in June of 2014.
Actual work on the project began in October of 2013 and was completed in June of 2014.
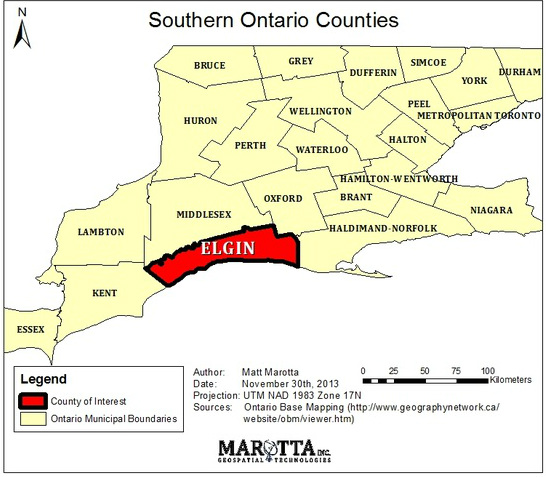
Study Area
Project Background
Ontario South Coast Wines (OSCW) represents wineries and grape growers in South Central Ontario, specifically ones that are located within Elgin County, Norfolk County, and Essex. OSCW has a mission to help the wine industry in South Central Ontario thrive and envisions the area achieving a Designated Viticulture Area (DVA) status. This DVA status will allow wineries to place additional information on their labels, making them more easily identifiable as a wine of higher quality.
In order to work towards achieving a DVA status, a topographic analysis of Elgin County for vineyard site suitability must be conducted. By determining areas of high, moderate, and low suitability for producing wine grapes, two key pieces of data necessary for becoming a DVA can be estimated: total harvest potential and usable hectares. In order to accomplish this task, a Geographic Information System (GIS) will be used because of its ability to organize, display, and manage the data needed to carry out the topographic analysis.
In order to work towards achieving a DVA status, a topographic analysis of Elgin County for vineyard site suitability must be conducted. By determining areas of high, moderate, and low suitability for producing wine grapes, two key pieces of data necessary for becoming a DVA can be estimated: total harvest potential and usable hectares. In order to accomplish this task, a Geographic Information System (GIS) will be used because of its ability to organize, display, and manage the data needed to carry out the topographic analysis.
Data Sources
2010 South Western Ontario Orthophotography Project (SWOOP) Data
- Mass-Points and Breaklines
- Source: Ontario Ministry of Natural Resources
1983 Agricultural Resource Inventory Data
- Shapefile containing polygons for land-uses
- Source: Ontario Ministry of Food and Agriculture
Water well data for Ontario
- Points shapefile that contains water well data for all of Ontario with fields for the soil depth to bedrock, depth to groundwater, and depth to static groundwater fields
- Source: Ontario Ministry of the Environment
Soils shapefile
- Polygon shapefile that contains fields for soil pH values and soil drainage
- Source: Government of Canada
Municipal boundary and Lake Erie Shapefile
- Elgin County's municipal boundary and Lake Erie shapefile
- Source: Geobase
Raster Layers
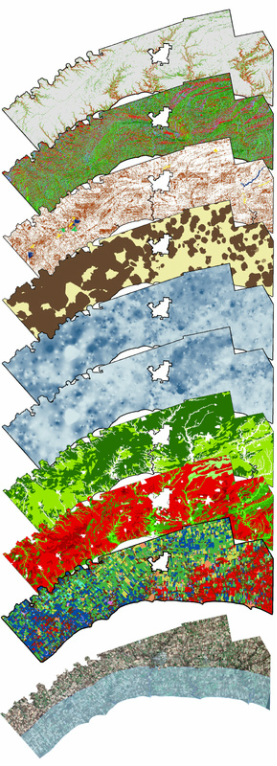
Slope & Aspect
Created from 2010 South Western Ontario Orthoimagery Project (SWOOP) data. Elgin is dominated by land with little to no significant slopes.
Topographic Depression Areas
Created from 2010 South Western Ontario Orthoimagery Project (SWOOP) data and ArcHydro Tools extension (Depression Evaluation Tool).
Soil Depth to Bedrock, Depth to Groundwater, & Depth to Static Groundwater
Created from Ontario Ministry of the Environment Water Well Data. Each of these three layers was interpolated and thus will not have a significant influence in the raster calculation.
Soil pH Levels and Soil Drainage
Created from the Government of Canada's Soil Survey Reports for Ontario.
Land Use
Created from 1983 agricultural resource inventory data. Elgin is dominated by Tobacco Fields, Corn Systems, and Continuous Row crops.
Shoreline Buffer
Will not be used in the raster calculation, but created to show the extent of Lake Erie's climate moderating effect within Elgin County.
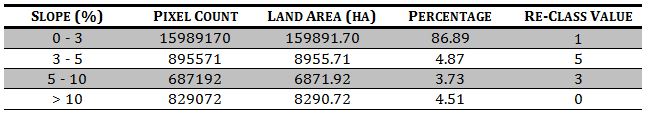
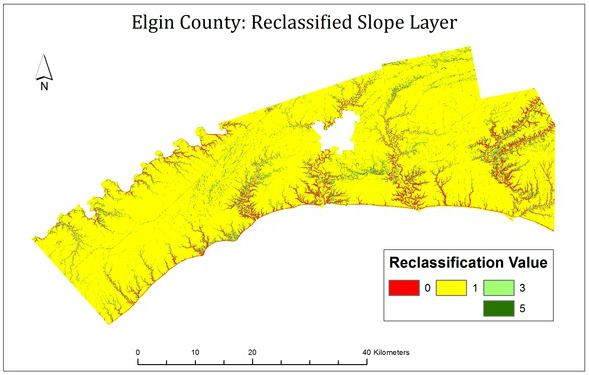
Layer Reclassification
Each of the nine layers above were then reclassified to assign high values to suitable areas and low values to unsuitable areas. For example; slopes greater than 10% received the lowest value because they do not allow cold air to drain, are susceptible to soil erosion, and make it difficult to operate farm equipment. Slopes between 3% and 5% were given the highest value because they allow cold air to drain, are not susceptible to soil erosion, and do not make it difficult to operate farm equipment. See below for a sample map/chart outlining how the slope layer was reclassified.
Pair-Wise Multi-Criteria Evaluation
In order to determine the weights for each of the nine layers to be used in the raster calculation, a Pair-Wise Multi-Criteria Evaluation (MCE) was conducted. A great resource that explains the Pair-Wise MCE can be found by clicking this link. After conducting the Pair-Wise MCE, the following weights were assigned to the nine variables:
|
Soil Drainage - 27.03%
Soil pH - 2.09% Slope - 24.27% Aspect - 22.38% Land Use - 9.87% Depression - 3.30% Groundwater Depth - 3.48% Groundwater Static - 3.48% Soil Depth - 4.10% |
Raster Calculation
Finally, the Raster Calculator was used to create the final site suitability layer. The raster calculator was also used to remove roads (buffered to a distance of 50 metres) and hydrology (buffered to a distance of 40 metres) features. This made it possible to calculate the total land area for different levels of suitability based on a 6 and 3 class breakdown. These results are illustrated in the table below.
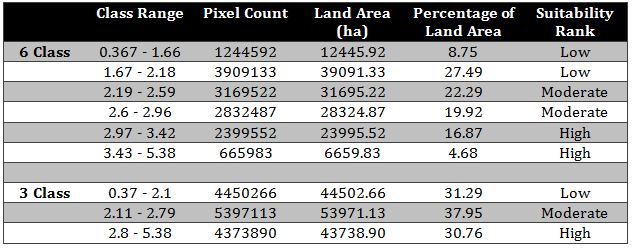
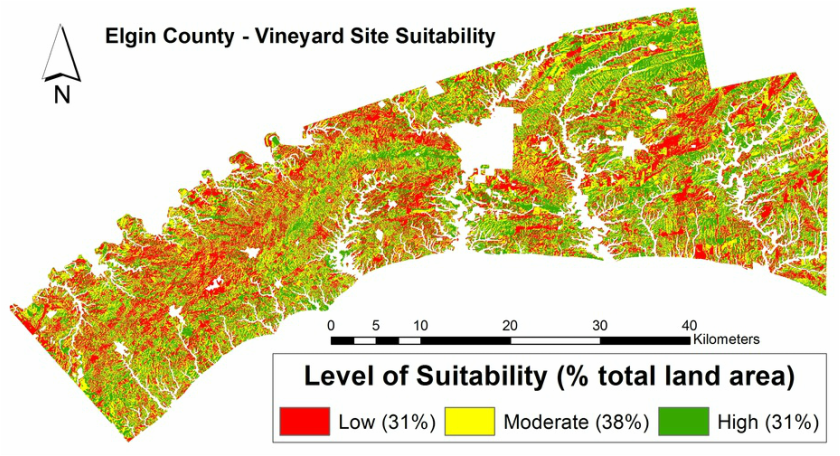
The final result is shown below using a 3-class breakdown. For a high quality version of the map (that was selected to appear in the 2015 ESRI Calendar), click here.
Final Notes
The completion of this project required 219.5 hours and cost $21,047.38 (this value was prepared for learning purposes only and was not incurred by the client).
