Other Mapping Software
Within a four-month long course dedicated to cartography, I completed various workshops which developed my skills within MapInfo Professional and Manifold.
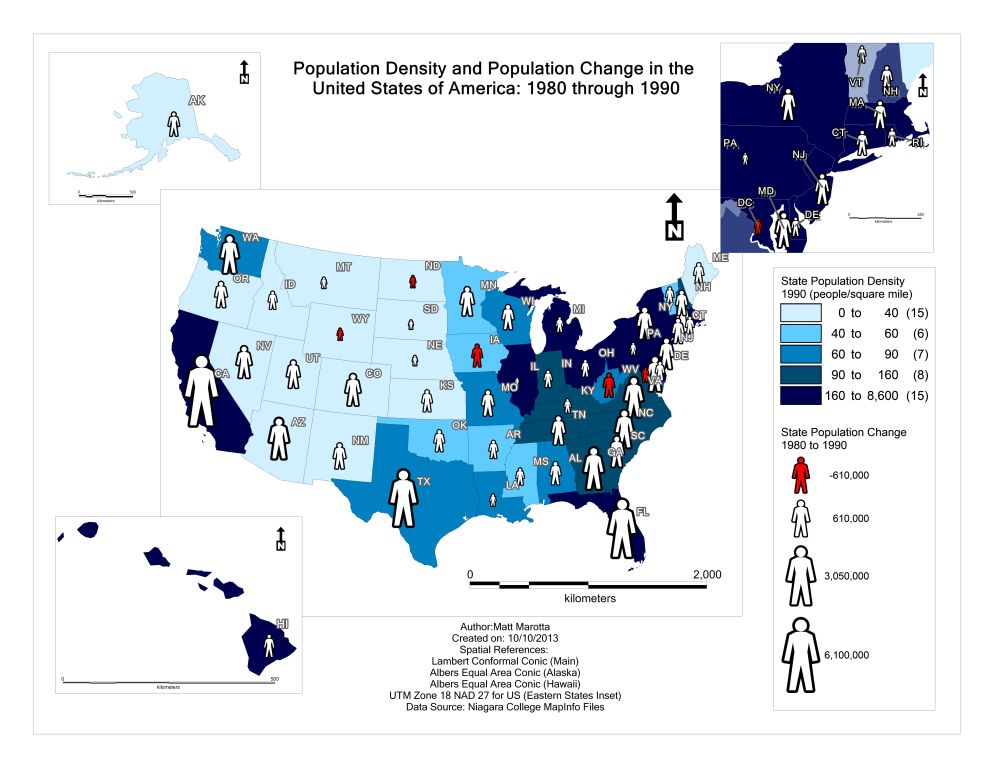
MapInfo Professional
Within MapInfo, I utilized the choropleth method to map population density of the United States in 1990. Using the proportional symbol method, I mapped the state population change from 1980 to 1990. Both variables exist on the same map. In creating this map, I found that I had to make use of class intervals, insets maps, symbology and symbol sizing, and all the cartographic elements of a professional map. This deliverable also improved my skills with MapInfo because it was very necessary to experiment with the different options available within the program to create the best map possible.
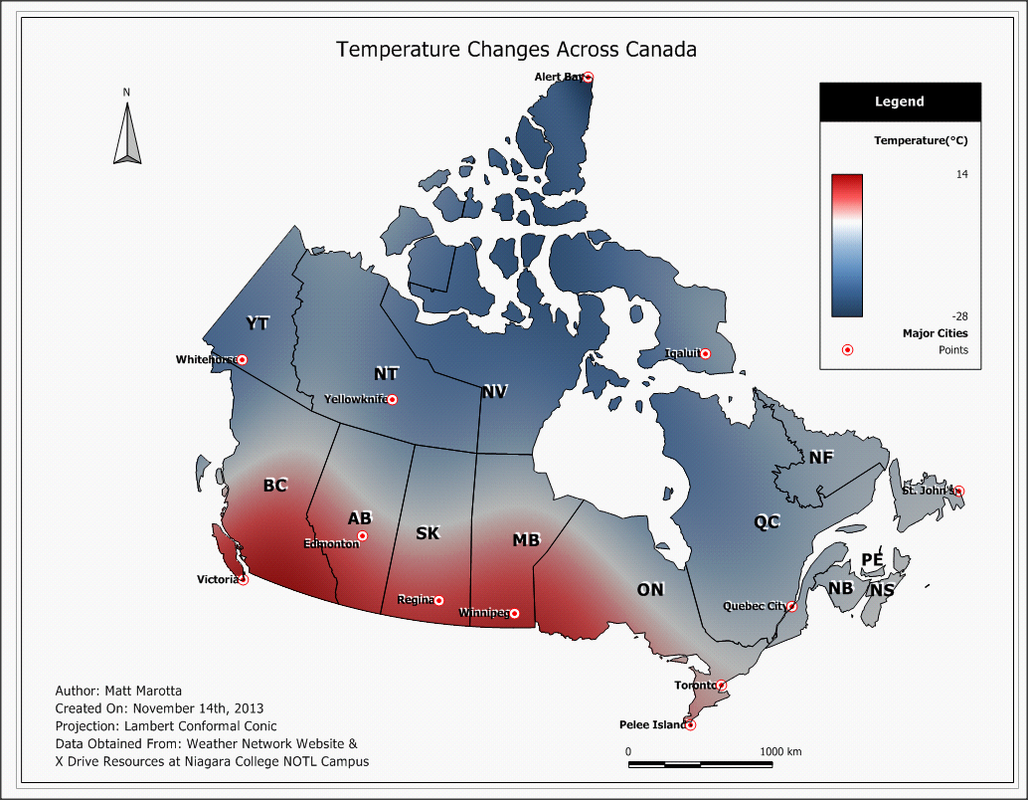
Manifold
This deliverable consists of a gradient map of temperatures across Canada. The temperature data for this map was acquired from the Weather Network website on Wednesday November 13th between 4:30 and 5:00pm. The latitude and longitude data was acquired from a Latitude/Longitude website (http://www.latlong.net/) which utilizes Google maps.