Train Derailment Risk Assessment
SCENARIO:
Since the oil spill in Lac-‐Ménantic, Quebec in 2013, there has been a heightened alert concerning the impacts of potential train derailments on people and the natural environment. It will be your job to build a GIS tool that can be used to highlight areas that require immediate emergency services in the event of a derailment.
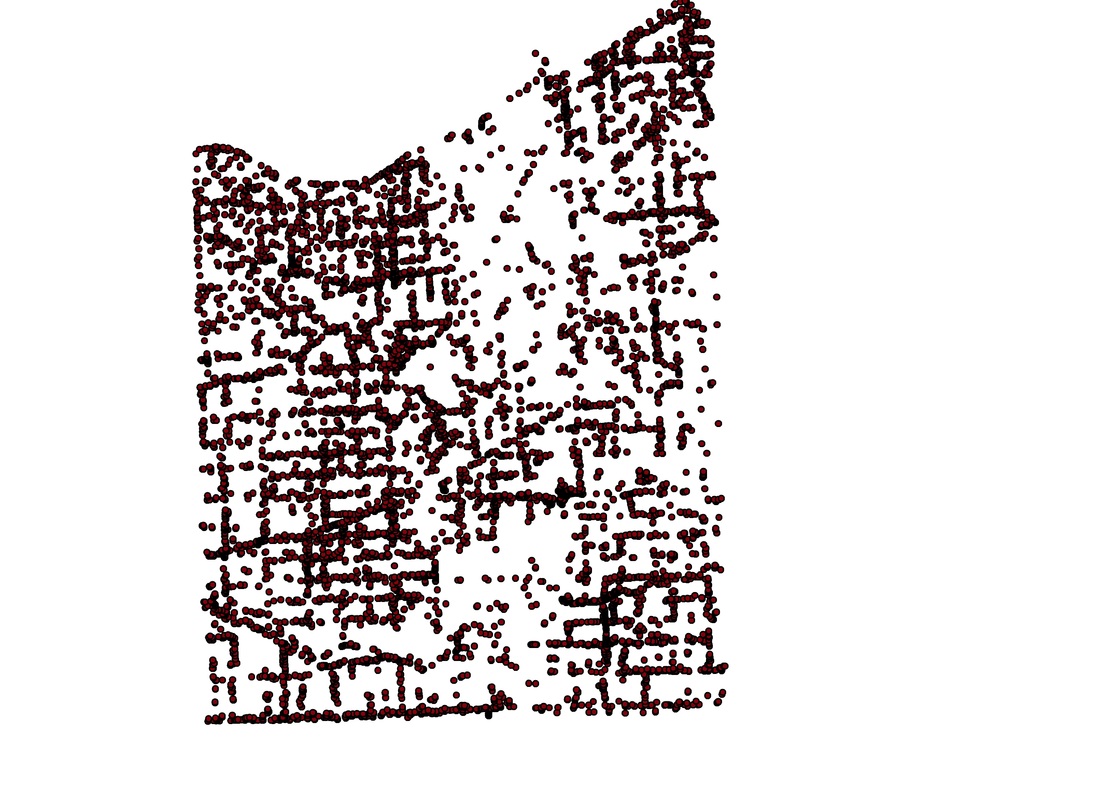
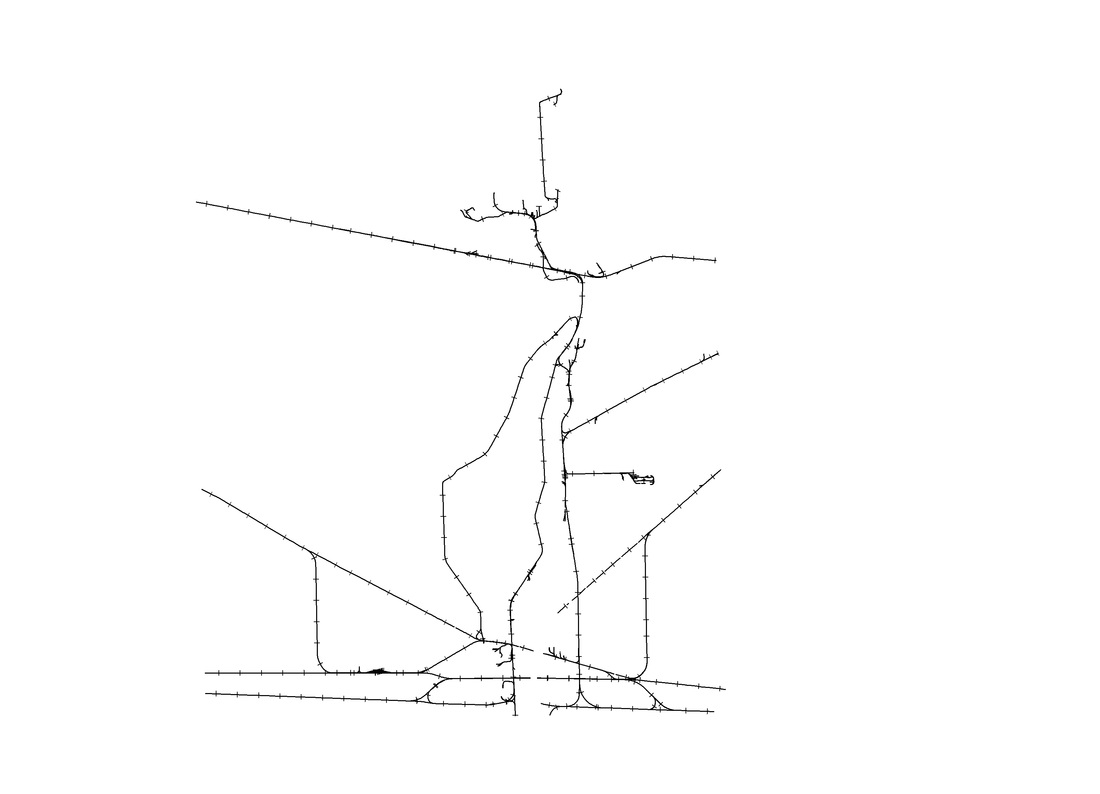
Raw Data
Script
Quick Overview
- Quantify the curve of each rail segment with an index value
- Determine threshold index value distinguishing 'dangerous' from 'safe' curves
- Output dangerous curves to shapefile and buffer 500 metres
- Clip buildings to dangerous curves buffer
- Create kernel density raster of buildings: final layer representing severity of train derailments
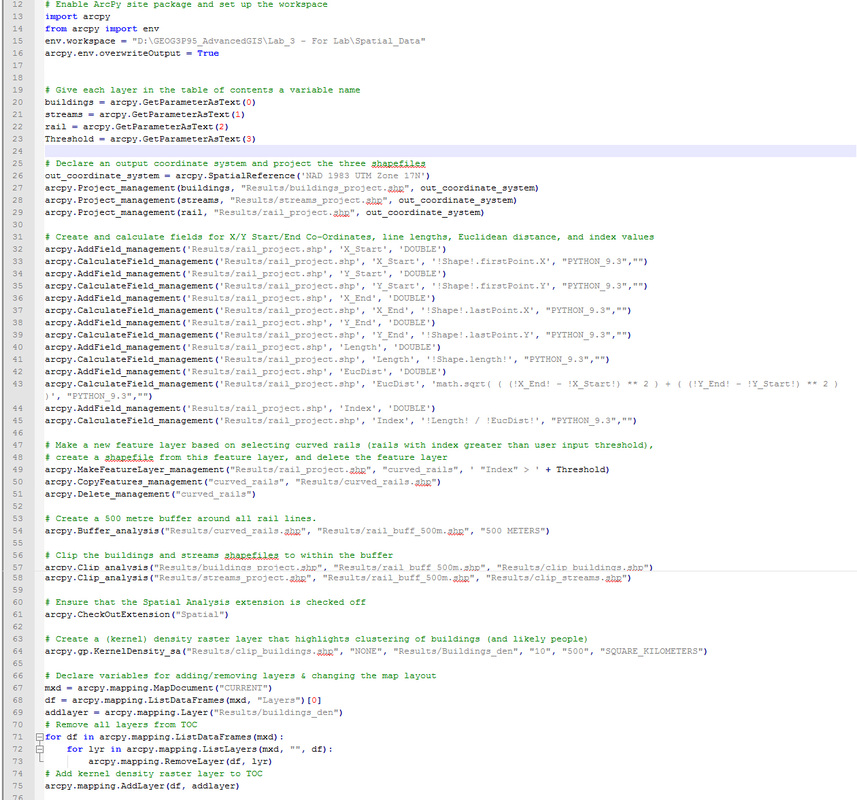
Detail
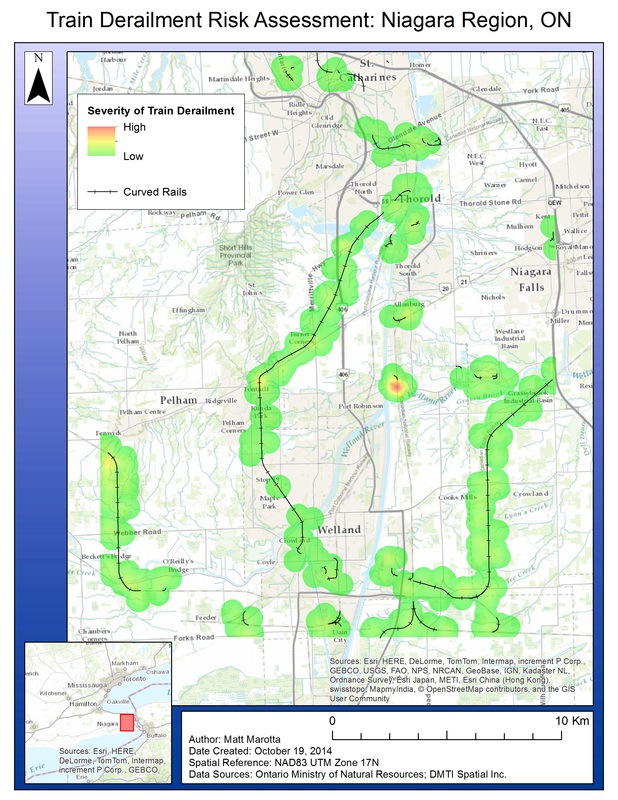
The script, which follows the GUI, first assigns an index value to each railway segment that represents the degree to which that segment is curved. This is accomplished by dividing the actual length of the segment by it's euclidean distance. The GUI for this tool (see below) allows the user to enter a threshold that will determine which rail segments are selected. Entering a higher threshold means that the tool will select rail segments only with larger curves, and thus less segments will be selected. The selected railway segments are output to a shapefile and buffered to a distance of 500 metres. Then, the buildings shapefile is clipped to the railway segments buffer. Using the clipped buildings, a kernel density raster is created that highlights the clustering of buildings (and likely people). This kernel density layer acts as an indicator of the severity of a train derailment and can be used to suggest which areas require immediate emergency services.
The script, which follows the GUI, first assigns an index value to each railway segment that represents the degree to which that segment is curved. This is accomplished by dividing the actual length of the segment by it's euclidean distance. The GUI for this tool (see below) allows the user to enter a threshold that will determine which rail segments are selected. Entering a higher threshold means that the tool will select rail segments only with larger curves, and thus less segments will be selected. The selected railway segments are output to a shapefile and buffered to a distance of 500 metres. Then, the buildings shapefile is clipped to the railway segments buffer. Using the clipped buildings, a kernel density raster is created that highlights the clustering of buildings (and likely people). This kernel density layer acts as an indicator of the severity of a train derailment and can be used to suggest which areas require immediate emergency services.
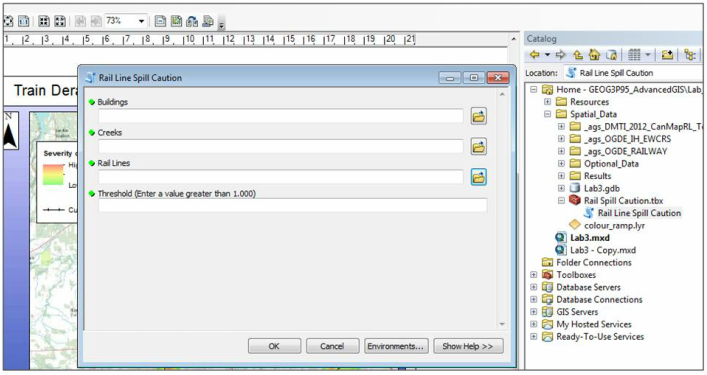
Script GUI.
Result